Loading lesson…
Evals: reading the results
20 min read
A score goes up. Did the prompt get better, or did something else change? An output cites three sources. Do they say what it claims? This module is about reading eval results and individual outputs skeptically, so you can trust what you ship and explain why. The goal is an accurate picture, not a higher number.
What you will be able to do
- Isolate changes before causal attribution, and Reproduce format failures and validate fixes on fixed cases.
- Run Required summary coverage checks, Diagnose truncation, placement and long-input loss, and Report conflicting figures with source locations.
- Verify each citation supports its attached claim, apply Numerical method, units and independent arithmetic check, and Design evidence-grounded statistics request.
- Know the difference in Checkable rationale versus private internal computation: Reasoning instructions need evidence and check criteria, and you should Compare hypotheses against confirming and conflicting evidence.
- Apply Fair hiring evidence and subgroup error testing, Forecast assumptions and estimate labeling, and Summarize research limitations without overstated causality.
- Prioritize actionable code-review findings with evidence.
The idea
Was it the change?
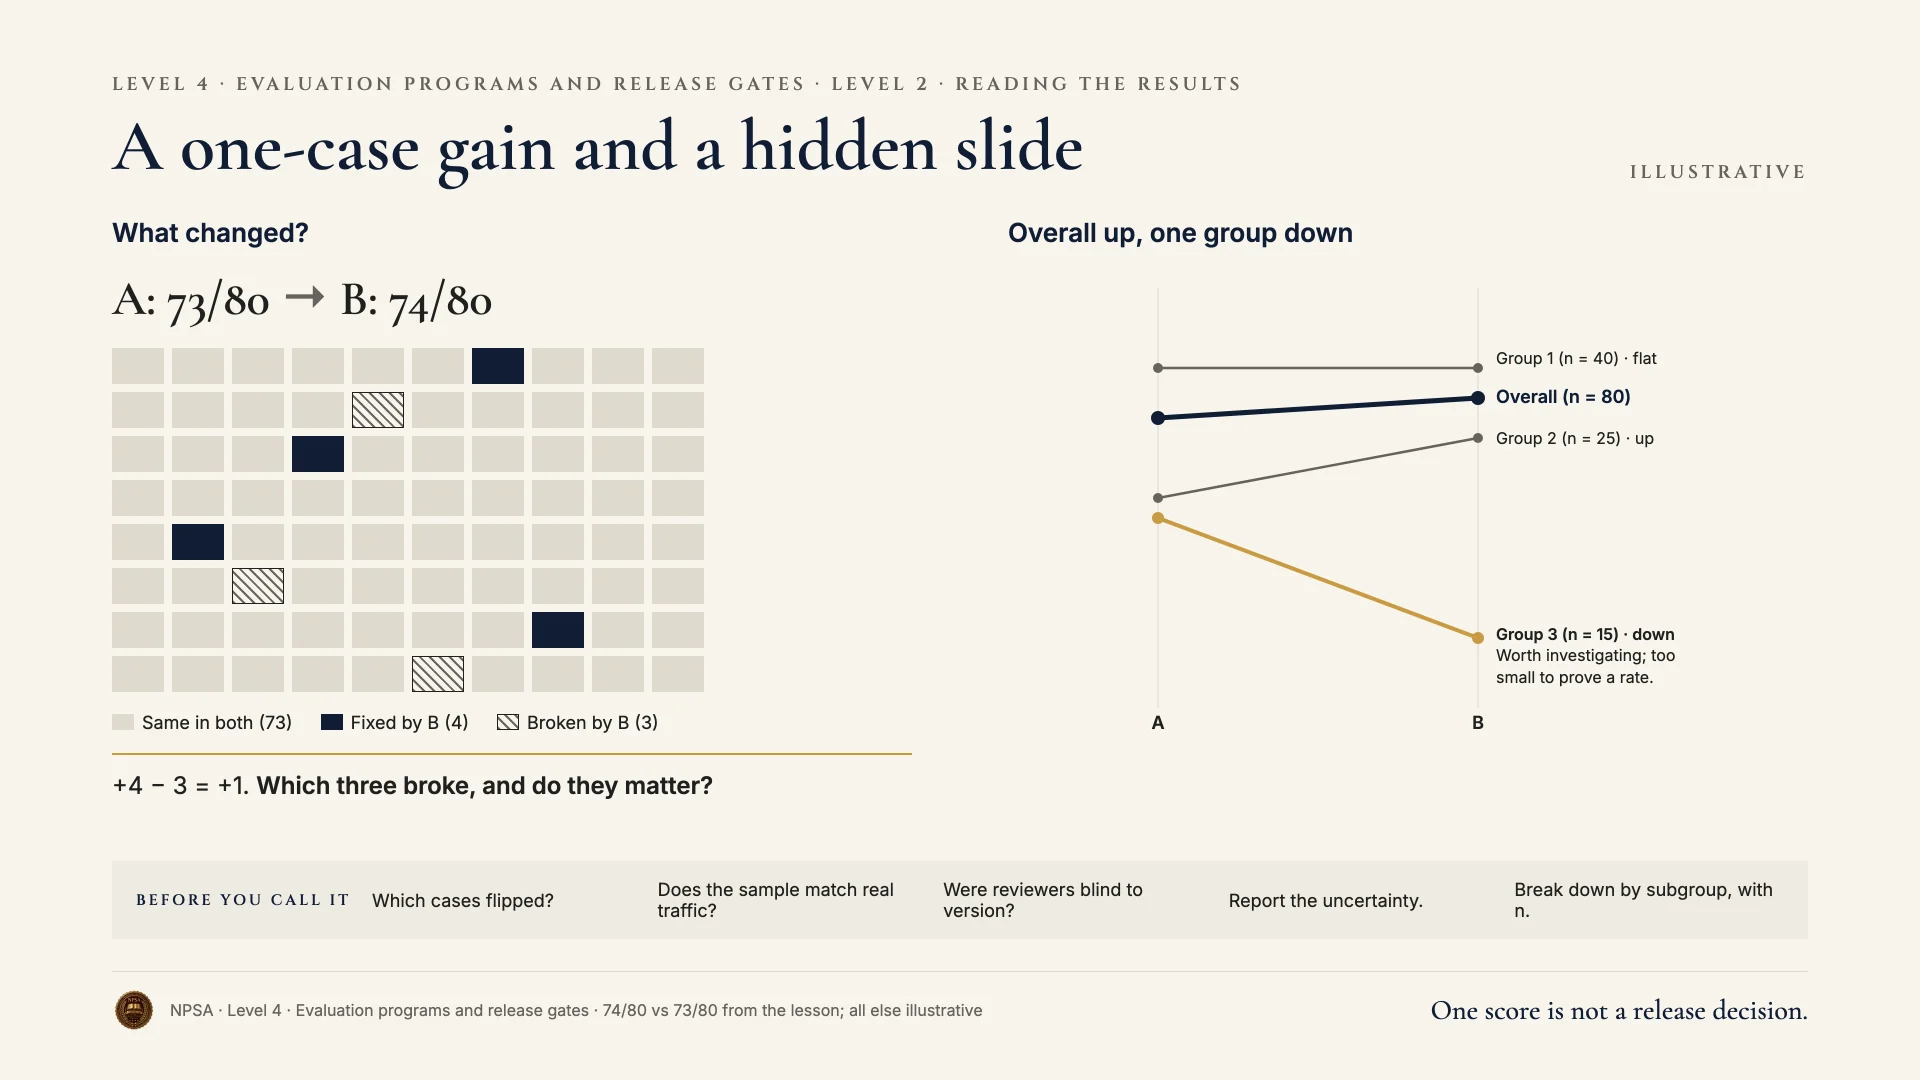
If you changed the prompt and the model in the same week, a score change can't be credited to either. Rerun with one variable changed and everything else fixed: cases, settings, rubric. When a format failure appears, save the input, confirm it fails repeatedly, then confirm your fix on the full set, not just that case.
Is it complete and supported?
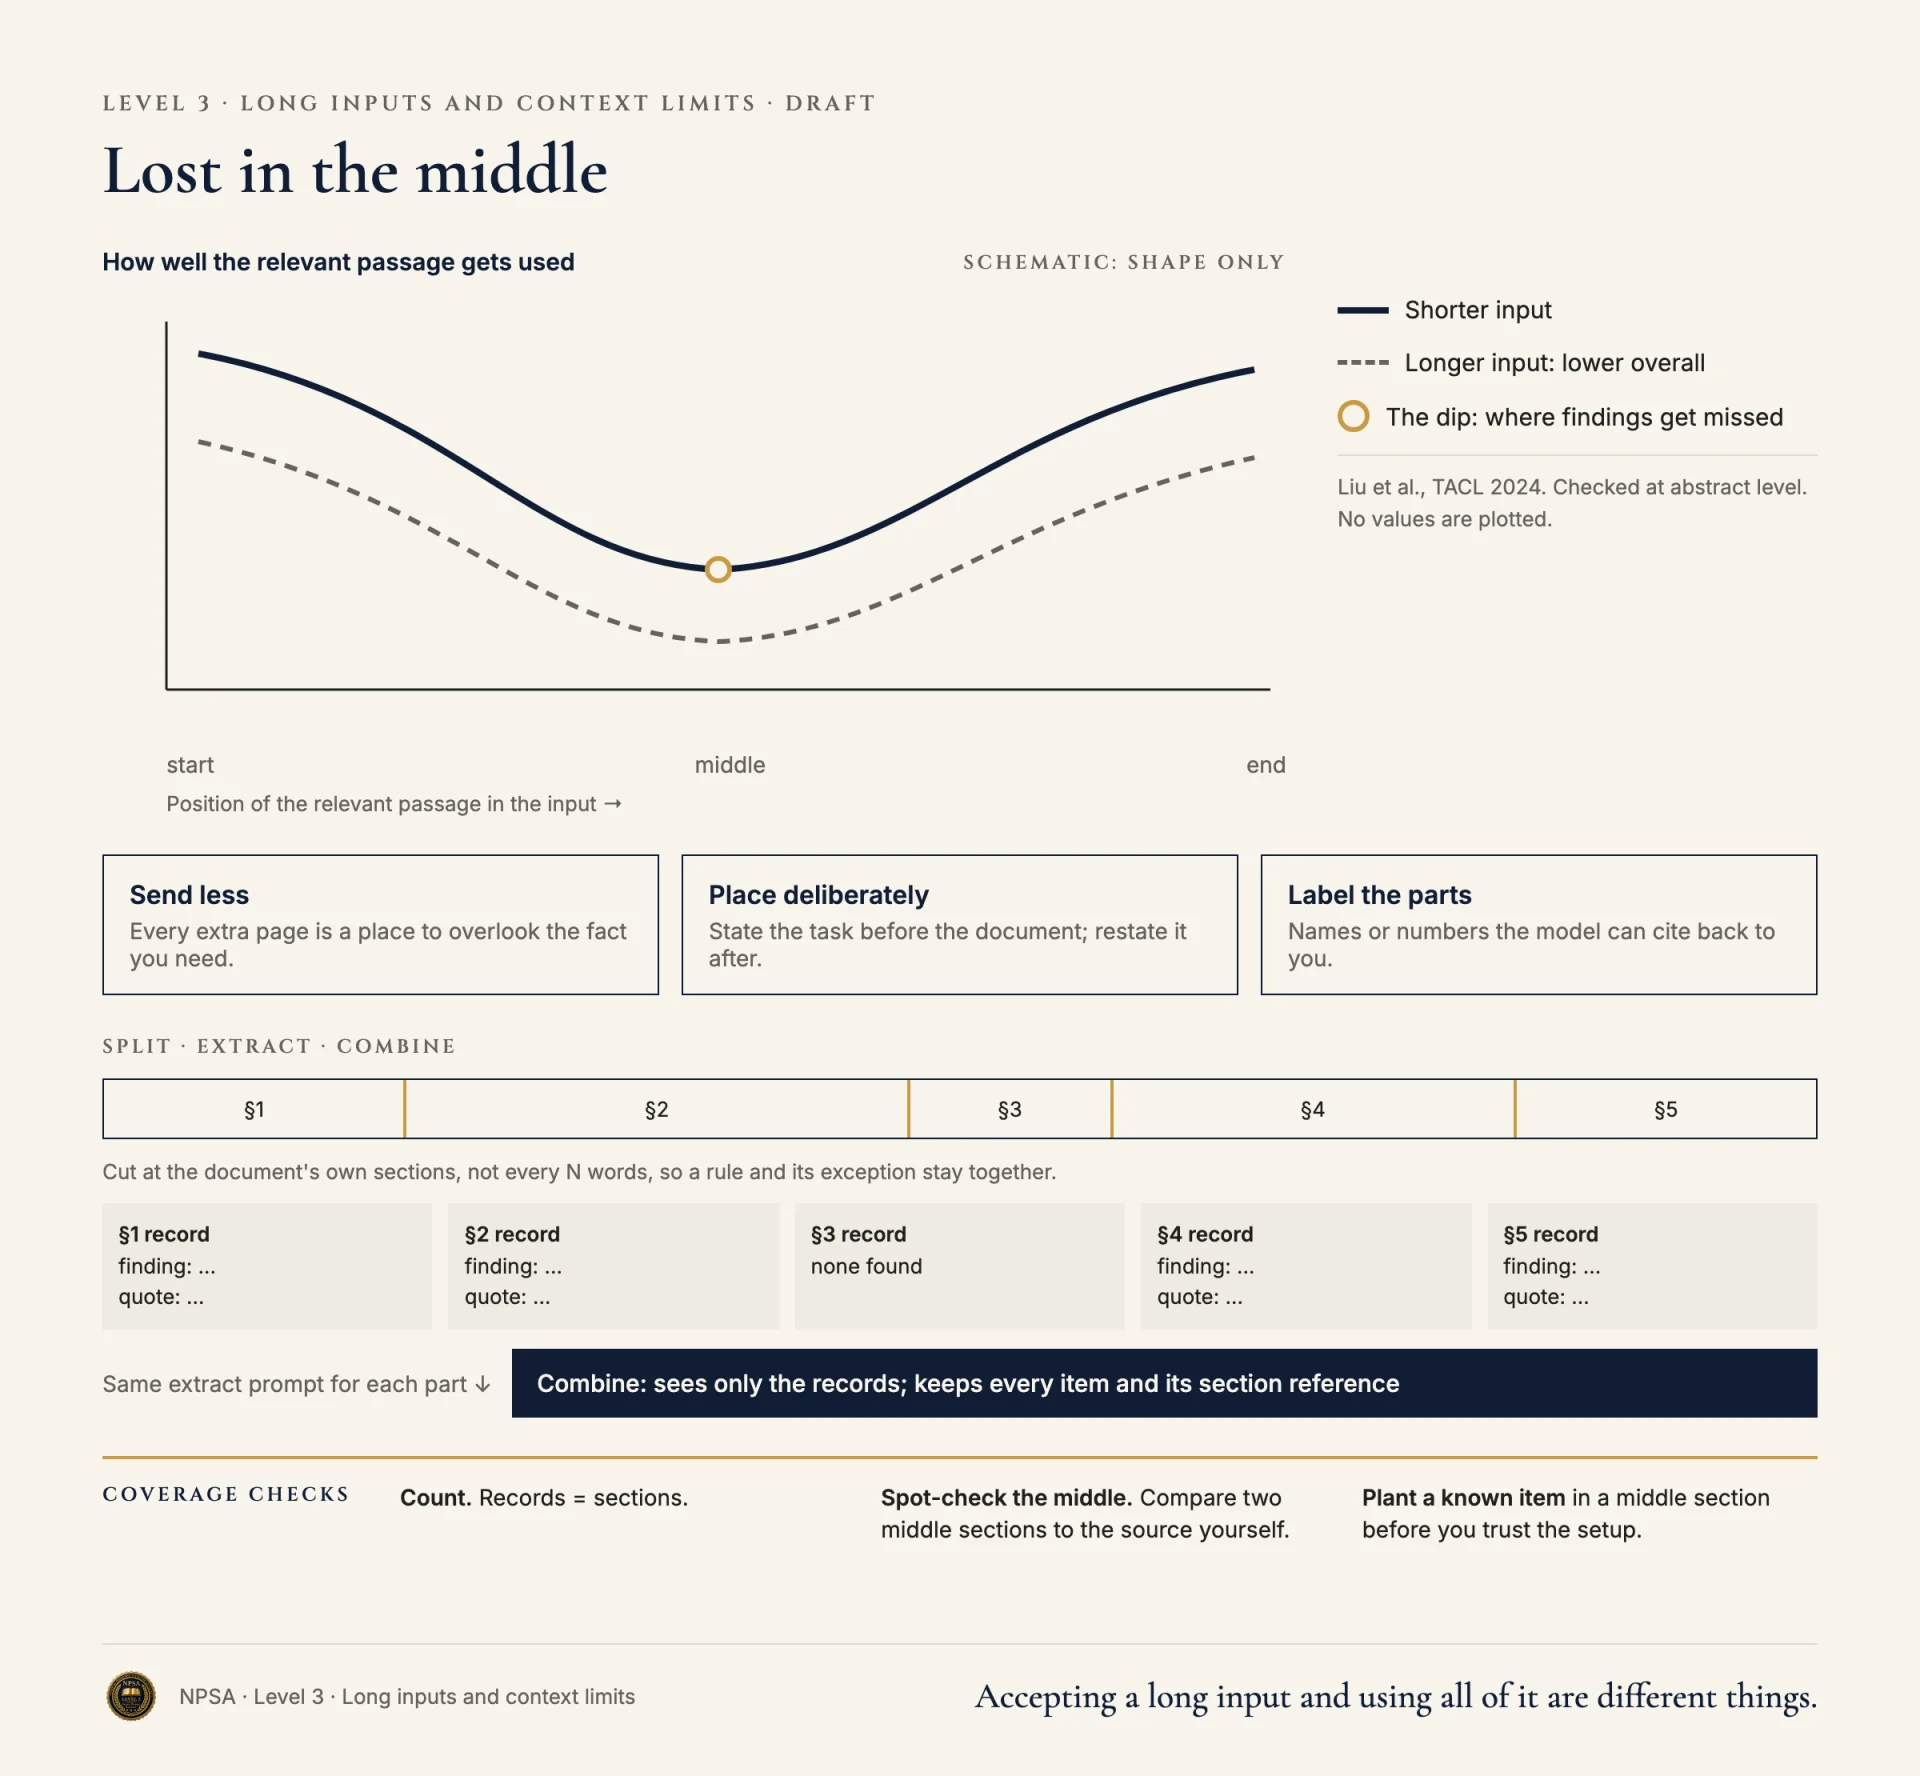
Check outputs against a coverage list built from the source: required sections, exceptions, dates, appendices. Missing content often means the input was too long, was cut off, or put key material where it got less attention. Test by moving the section or shortening the input. When sources disagree on a figure, the output should report both with locations, not average them. Open each cited passage and confirm it supports the specific claim, with the same measure, population, and period. When you ask for statistics, ask only for figures with a source location, and allow "fewer figures" as an answer.
Are the numbers right?
Require the method: inputs, units, formula, result. Then recompute independently in a spreadsheet. Forecasts must say they are estimates, list their assumptions, and give a range.
Is it reasoning or a story?
A model's explanation is generated text, not a transcript of how it computed the answer. Don't treat "show your thinking" as proof. Instead, ask for checkable rationale: the evidence cited, the evidence against, and a test that would tell competing explanations apart. A reasoning instruction is only useful if it names what evidence counts and how you'll check it.
Is it fair, and is it honest about limits?
For decisions about people, an overall accuracy number can hide uneven errors. Check false positives and false negatives by relevant group, using properly governed data, and make sure criteria rest on job-related evidence. When summarizing research, keep association separate from causation and state the study's limitations.
Is it actionable?
For code review, a short list of defects, each with location, trigger, impact, and a test, beats a long rewrite. Score reviews on whether findings are real and fixable.
Worked example
Hana Novak's team uses a prompt to summarize customer-research interviews for product managers. Version 4 scored 82% on their 40-case rubric. Version 5 scores 91%. A teammate wants to ship it.
Weak approach. Ship v5 on the strength of the number.
Better approach. Hana reads the result before believing it.
- Isolation. v5 also switched to a newer model. She reruns v4 on the new model: 89%. The prompt change is worth about 2 points, not 9.
- Coverage. Three of the 40 summaries omit the "pricing objections" section. All three come from interviews over 9,000 words, where pricing comes up last. She tests moving the coverage list to the end of the prompt and rerunning those cases.
- Citations and numbers. One summary says "62% of interviewees cited onboarding." She counts: 11 of 20, which is 55%. The cited quote supports "onboarding" but not the percentage.
- Causality. Two summaries say "the redesign caused higher satisfaction." The interviews show association at best.
She adds a review prompt to the eval:
Before:
Check this summary and explain your reasoning.
After:
For each claim in the summary:
1. Quote the interview passage that supports it, with interview ID
   and timestamp, or write "unsupported".
2. For any percentage, show numerator, denominator, and result.
3. Flag causal language not supported by the source.
4. List required sections from the coverage list that are missing.
Return findings only. I will recompute all figures independently.
Why this is stronger. The score is decomposed into causes. Truncation is diagnosed rather than assumed away. The review asks for evidence and arithmetic Hana can check, instead of a narrative about reasoning.
Try it
Setup. Take any summary or report an AI tool produced for you that contains at least two numbers and two cited claims.
Task. In a spreadsheet, list each claim. For each, find the source passage and mark supported or unsupported. Recompute every number. Mark any causal wording.
What a good result looks like. Every claim has a location or an "unsupported" mark. Your recomputed figures either match or the mismatch is recorded. You can state in one sentence what you'd change before trusting the output.
Recap
- Change one variable before crediting a result.
- Check coverage, citations, and figures against sources, not appearances.
- Ask for checkable evidence, not a narrative of reasoning.
- Test errors by group, label estimates, and keep correlation apart from cause.
- Prefer short, evidenced findings over long rewrites.